Data Shown for the Date Range: Aug 1 - Aug 31, 2018
QCFSBO Analytics
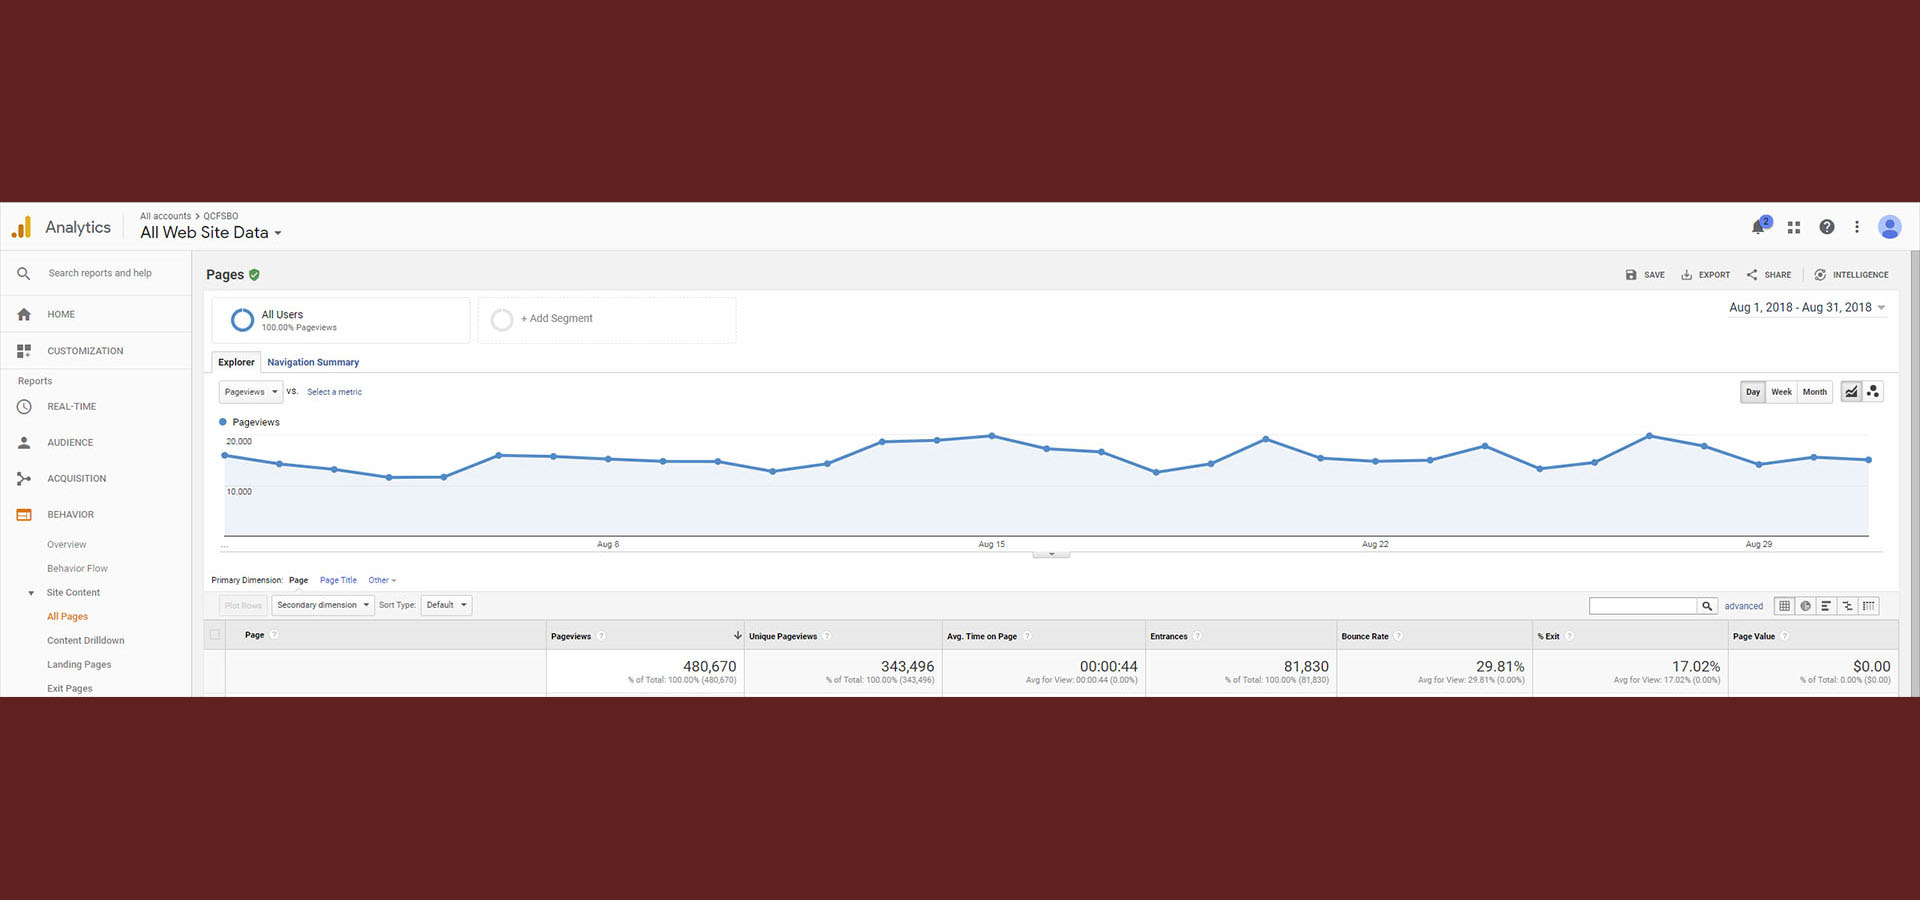
QCFSBO provides extensive statistical data on each listing posted on our website. All data generated by bots, spiders and our internal network traffic are filtered out to provide information as accurate as possible. All of our active customers can obtain real time data by calling our office. How your listed property compares to other listings can give vital information about market's response to your listing. For instance, if you are seeing high traffic numbers for your property but you are not receiving serious interest, it may indicate your pricing may be an issue there. Potential buyers are looking at your property but moving on to some other comparable property they feel is better priced. Should that happen, you can then revisit your asking price if necessary.
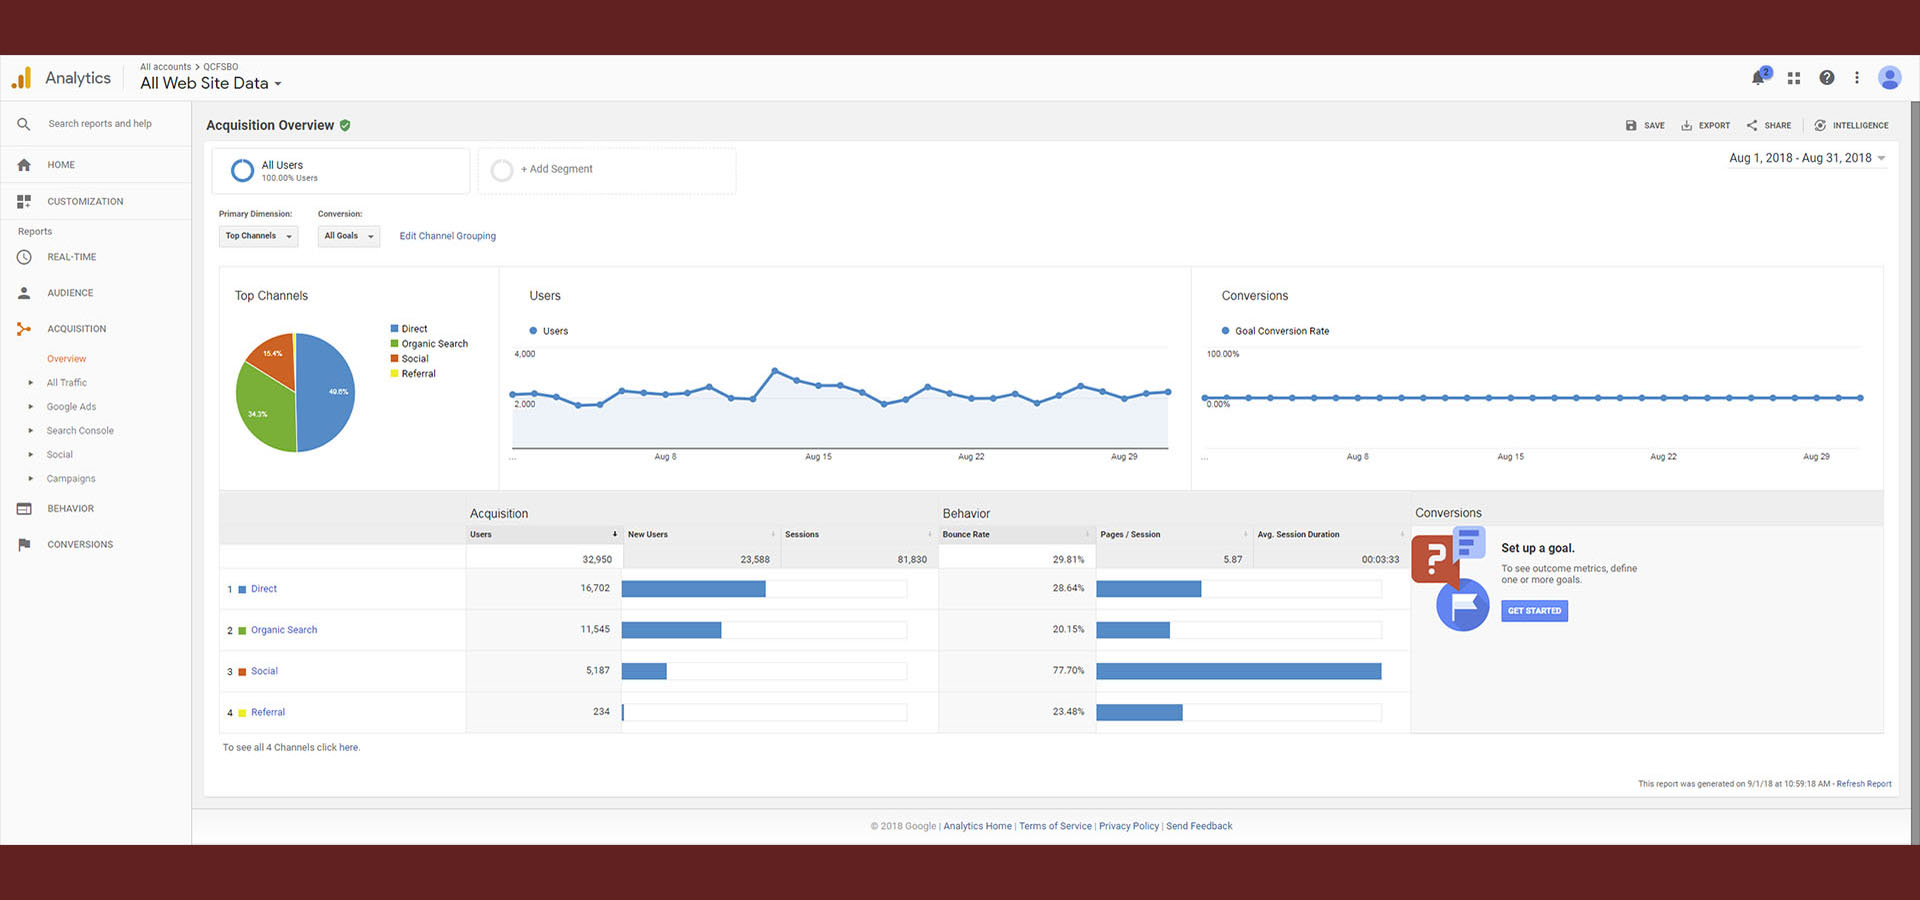
Social Media is an important part of your selling tools. Don't forget to share your QCFSBO listing from our Facebook, Twitter and other social media channels. 14.74% of our traffic in August 2018 was acquired from Social Media!
Content Drilldown
Since the statistical data can be customized, we can tell our customers how something like a price change has affected viewer interest in their property. This helps them decide if their price reduction or any other changes they have made is having the desired effect!